
Can you imagine how easy it would be to understand and explain things if you could turn workflows into clear and visual diagrams? You can do the same with Lucidchart. It is really effective as it simply take you the mess from your head and makes it simple, easy to understand and executable in real life.
Sounds interesting, right? Whether you are documenting an SOP or onboarding a new hire, it can help you map, model, and manage processes.
Keep reading this post to learn what Lucidchart is, its use cases, features, and benefits.
Microsoft defines process diagrams as step-by-step visualizations, often drawn as flowcharts in which arrows show what happens next. That is the essential idea. Because several related terms are often used jointly, it helps to understand their discrepancies before starting a review.
Consistency matters more than visual appeal. AHRQ’s process mapping guidance proposes using consistent symbols so that everyone present reads the map in the same way.
The value of process visualization often stands out in routine operational work:
Organizations often bundle process visualization with other smart digital tools for business efficiency to reduce manual work, improve collaboration, and create more effective workflows across teams.
Common diagram types are divided into four categories. Below is how to use them:
Many diagramming tools offer these formats. Miro, for example, provides pattern libraries for flowcharts, BPMN diagrams, value stream maps, and swimlanes. Before setting up a format, think who will read the diagram and how much detail they need.
Also, learn how AI is changing visual content and digital advertising.

Lucidchart is a diagramming platform built for workflows such as process mapping, system documentation, and public review. The capacity listings below are based on the vendor’s product and documentation pages, so teams should independently verify that each feature is available on the plan they are picking.
Lucidchart also offers supplemental AI features. According to its shared documentation, these features use Azure OpenAI Service, may hold inputs and outputs for up to 30 days, and do not use customer data to simulate third-party models. Privacy terms and product modifications can change, so teams working with vulnerable process data should verify the current documentation and complete an internal security review before implementing AI features.
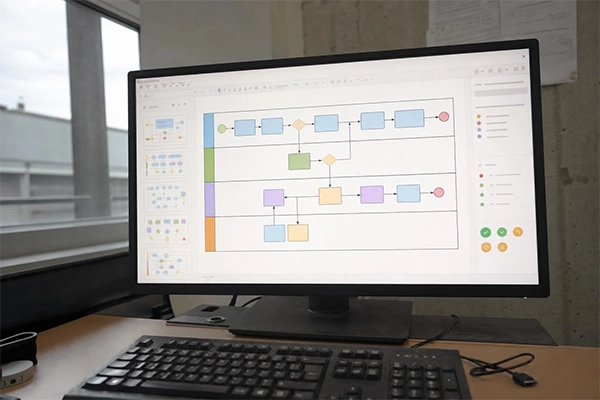
For teams that demand data-linked diagrams, text-generated flowcharts, and connections to existing workplace tools, Lucidchart is a fair option to evaluate. The final pick should depend on diagram specifications, governance needs, and how well the platform fits the team’s current routine.
The right diagramming tool relies partly on where the team already works and how diagrams will be stored, analysed, and shared.
When contrasting these tools with Lucidchart, test a real process rather than dwelling only on feature lists. A short pilot can reveal whether grants, exports, integrations, and review workflows behave as envisioned.
Below is a quick and complete decision checklist to follow:
A first version does not need to be specific. Interview the people doing the work, sketch the steps and swimlanes, reconstruct the sketch in a suitable template, and certify it with stakeholders. Store the desired diagram somewhere with clear ownership and version history.
Also, explore inside the new YouTube algorithm version and what it means for small channels.
At the end of the day, Lucidchart serve as a great option when teams demand for a collaborative, data-connected diagrams that mix easily with routine tools. But this is not the only thing – your best choice depends on your workflow, governance demands and where your team already works.
The core idea is to begin small, thoroughly check for the stakeholders, and choose the tool that meets your demand needs, processes and not any other way.
Ans: Process mapping documents how a task is done, and process modelling serves as a more structured version that software can understand.
Ans: Yes, it can easily connect to Google Sheets, Excel, and CSV files. This way, diagram can show live or maintained lists of steps and assets.
Ans: Microsoft Visio serve as great for terms already in the Microsoft ecosystem. draw.io is best when it is about data privacy.
