
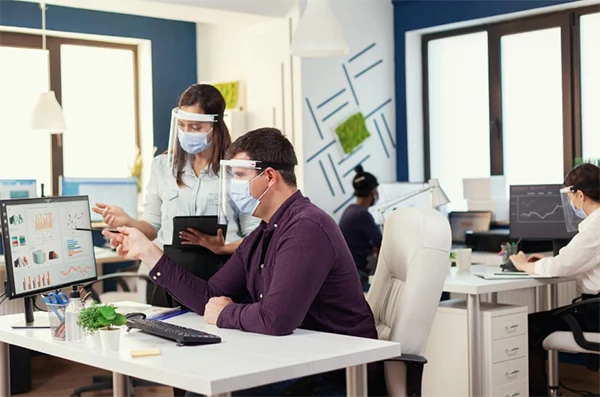
As hybrid work culture is starting to take place in offices all over the world, it is also making office space difficult to understand. Previously, facility leaders used to depend on full floors and predictable routines to check if any renovation was required. But now, because of hybrid work culture, it is difficult to understand, as on Monday there might be 40 people were on office and on wednesday its 110.
This difference between capacity and actual usage is costly. Most of the companies overpay for square footage they really don’t need, under-resource the spaces employees genuinely require. The market often responds to close the gap by attacking the problem from a different angle.
The best workplace strategies are actually the ones that check for more than one category, because no single data source captures the complete picture of how a building operates day to day. So, this article includes seven platforms that are organized by the type of insight they deliver.
Category: Physical sensing and real-time occupancy data
Butlr’s sensors detect body heat to determine how many people are in a space, how long they stay, and how they move between zones throughout the day. Because the technology reads thermal signatures instead of capturing images, there’s no camera footage, no facial recognition, and no way to identify a specific individual from the data.
That design choice removes most of the privacy and compliance obstacles that slow down large-scale sensor rollouts, particularly in regions governed by strict data protection regulations.
The platform offers headcount, dwell time, traffic flow, and time-of-day trends. That combination gives facilities teams a granular view of how rooms, desks, and open areas perform across a complete portfolio. Butlr’s wireless sensors (the Heatic 2+, which won Fast Company’s 2025 Innovation by Design Award) work on multi-year batteries and install with adhesive mounting, which means a team can instrument a full building in days instead of coordinating electrical contractors over several weeks.
The camera-free design also allows sensors to cover sensitive areas like restrooms, prayer rooms, and healthcare facilities, which camera-based systems simply cannot monitor.
The platform is SOC 2 Type II certified and built around an API-first architecture, making it direct to pipe occupancy data into building management systems, booking platforms, and BI dashboards. Enterprise customers such as Verizon, Netflix, Microsoft, and CBRE use Butlr across global portfolios spanning hundreds of millions of square feet.
Key Features:
Category: Reservation management and scheduling intelligence
Robin offers employees a single interface for reserving desks, meeting rooms, and other shared resources, while feeding that booking activity into an analytics layer that facilities teams can use to spot trends. Its real-time office maps show which spaces are open, which are reserved, and who’s thinking to be onsite on any given day, which is a particularly useful feature for hybrid teams trying to coordinate in-person overlap.
Robin’s analytics are most important for surfacing reservation-versus-reality gaps. Its analytics dashboards (including newer Desk Insights and Space Insights views) help administrators check chronically underbooked neighborhoods, peak reservation windows, and rooms that get reserved but never occupied. Multi-location enterprises gain from centralized reporting that compares booking behavior across offices and regions.
Key Features:
Category: Front-door-to-desk workplace management
Envoy started as a visitor management platform, managing guest sign-in, badge printing, NDA workflows, and host notifications, and has since expanded into a broader workplace operations suite. Today it includes desk booking, room scheduling, delivery tracking, emergency communications, and digital signage from a single dashboard. That breadth makes it appealing for organizations that want one platform handling both the employee and visitor experience without stitching together point solutions.
From a utilization standpoint, Envoy covers desk and room booking data, attendance trends, and visitor traffic logs in one place. Employees can book by the hour, day, or week through a mobile app, and the system auto-releases no-show reservations to keep availability correct. Neighborhood-based seating allows administrators to group teams by function or project.
Key Features:
Category: PIR-based presence detection hardware
Disruptive Technologies (DT) builds some of the smallest wireless sensors on the market, designed to answer one straightforward question across large deployments. Is this desk or room full right now? Their desk occupancy sensor measures just 19×19×3.5mm, mounts under a desk surface with adhesive backing, and works for up to eight years on a single battery. It uses temperature readings and machine learning to distinguish between an occupied and empty workstation without collecting any personally identifiable data.
DT’s product line also involves ceiling-mounted motion sensors for meeting room detection, environmental sensors for CO2, temperature, and humidity, and door sensors that track entry frequency. All sensor data goes into Studio, DT’s cloud-based management application, where teams can visualize occupancy heatmaps and export data via open APIs for integration with third-party workplace platforms.
Key Features:
Category: Survey-based workplace assessment and benchmarking
Leesman uses a globally standardized survey methodology to capture employee feedback on how efficiently a building supports the work people actually do, from acoustic quality and desk availability to collaboration support and commute satisfaction.
The result is an Lmi (Leesman Index) score between 0 and 100 that quantifies workplace effectiveness and benchmarks it against the world’s largest independent workplace experience database, built from roughly one million office respondents across more than 6,400 organizations in over 100 countries.
Leesman focuses mostly on workplace assessment rather than adapting a general employee engagement template. The benchmarking dataset gives organizations a credible external reference point instead of just internal trend lines. For organizations that already collect occupancy data through sensors or booking systems, Leesman adds the qualitative layer that shows the numbers, turning a low-utilization collaboration zone from a data point into a diagnosis.
Key Features:
Category: Building entry data and physical security infrastructure
Access control systems are hardly thought of as utilization tools, but the entry and exit data they generate is often the first occupancy signal a facilities team has access to. Brivo is one of the earliest and most popularly deployed cloud-native access control platforms in this category, securing over 100,000 access points across more than 60 countries. Its platform centralizes door access, video surveillance, visitor management, and intrusion detection under a single login, with all data stored and managed in the cloud instead of on local servers.
For utilization tracking, Brivo’s most important feature is its API layer. Badge swipe data from Brivo can be piped into workplace analytics platforms, booking systems, or custom dashboards to create building-level and floor-level attendance baselines. That data won’t tell a team which desks were used or how long a conference room was occupied, but it anchors the picture with an honest headcount of who entered which building and when.
Key Features:
Category: Portfolio-level space planning and facilities management
While the other platforms on this list generate utilization data, Eptura sits at the layer where that data gets transformed into portfolio-wide decisions. Formed from the merger of Condeco (room booking) and iOFFICE + SpaceIQ (space management), Eptura blends workspace booking, space planning, asset maintenance, and facilities management into a single enterprise platform. Verdantix named it a leader in its 2025 IWMS report, and Gartner recognized it in the 2026 Magic Quadrant for Workplace Experience Applications.
Eptura’s strength is aggregation. Its Envision business intelligence module pulls people, space, and asset data together into dashboards that help real estate leaders make lease, renovation, and headcount allocation decisions across buildings and states.
The platform includes AI-powered booking that indicates workspaces based on team dynamics, meeting requirements, and user preferences. It also integrates directly with IoT sensors, access control systems, calendar suites, and identity providers, acting as the connective tissue between the point solutions that create raw utilization data and the executives who act on it.
Key Features:
Each data source offers a different dimension of office utilization. Access control shows you who showed up but not where they sat. Booking data tells intent but not behavior. Sensors measure behavior but can’t describe employee sentiment. Surveys understand sentiment but are subject to recall bias.
The most effective workplace approaches layer complementary data sources, pairing a physical sensing platform with a booking system and benchmarking the results against employee feedback. The right stack relies on what decisions a team is trying to make. A real estate leader negotiating a lease renewal requires reliable headcount and trend data. An operations manager rethinking floor layouts needs traffic flow and dwell time. A workplace experience director evaluating employee satisfaction requires structured survey data with external benchmarks.
Begin with the decision, work backward to the metric that informs it, and choose the platform that delivers that metric reliably. The seven tools above represent the best options across the categories that matter most.
Ans: The software that is mostly used in offices is Microsoft 365.
Ans: Office tools are software that is designed usually for offices and helps users create, manage, and organize daily workplace tasks efficiently.
Ans: WFM, which is Workforce Management tools, helps companies plan and track how their employees work.
