5 Bitcoin Price Indicators You Should Know About
Bitcoin’s price has its price swings that often leave investors and traders at a loss for direction, so understanding market indicators is more essential than ever. These indicators can provide crucial insights into Bitcoin’s current price trends, market sentiment, and potential future movements.
This article explores five essential Bitcoin price indicators, each offering unique perspectives for anyone looking to navigate the Bitcoin market with more confidence. By the end of this read, you’ll know how to use each of these indicators effectively.
Bitcoin Price Indicators You Should Know About
Moving Averages (MA)
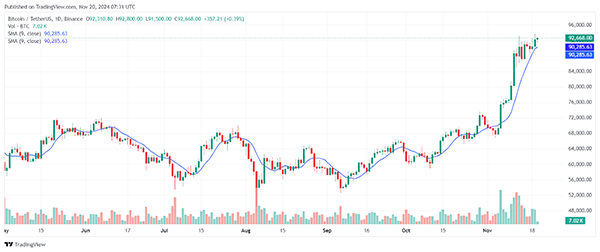
Moving Averages (MAs) are one of the most widely used tools in technical analysis. They smooth out price data by creating a constantly updated average price over a specified period. The result is a line that can help investors identify trends by filtering out the noise from volatile price fluctuations.
There are two primary types of MAs, the Simple Moving Average (SMA) which is calculated by adding up the prices over a set number of days (like 10, 50, or 200) and dividing by that number. The second is the Exponential Moving Average (EMA) which is similar to the SMA but gives more weight to recent prices, making it more responsive to new information.
How Moving Averages Work
Moving Averages work by highlighting price trends over time, making it easier to spot bullish or bearish patterns. The SMA offers a straightforward view of the trend, but the EMA is often preferred in fast-moving markets like Bitcoin due to its sensitivity to recent data.
Shorter MAs, such as the 10-day or 20-day, provide insights into short-term trends. Longer MAs like the 50-day or 200-day are useful for understanding long-term trends.
Two common signals derived from MAs:
- Golden cross: This occurs when a short-term MA (e.g., 50-day) crosses above a long-term MA (e.g., 200-day). It’s considered a bullish signal, suggesting a possible uptrend.
- Death cross: When the short-term MA crosses below the long-term MA, it’s a bearish signal that could indicate a downtrend.
Moving averages are frequently applied in Bitcoin analysis because they offer a quick overview of the trend direction. For instance, if the 50-day MA is above the 200-day MA, Bitcoin is generally in a long-term uptrend. However, if the opposite is true, Bitcoin could be in a prolonged downtrend.
Bitcoin NVT Ratio
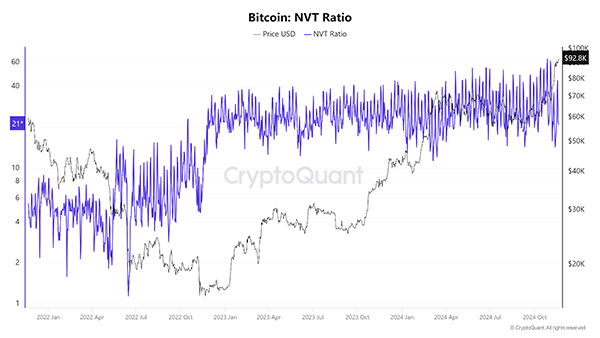
The Network Value to Transactions (NVT) Ratio is often referred to as the “Bitcoin PE Ratio.” Just as the PE ratio evaluates a stock’s valuation, the Bitcoin NVT Ratio does the same for Bitcoin by comparing its network value (market cap) to the value of daily transactions conducted on the network.
How Bitcoin NVT Ratio Works
The NVT Ratio is calculated by dividing Bitcoin’s market cap by the daily transaction volume in USD. It helps investors assess whether Bitcoin is overvalued or undervalued based on transaction activity. When the NVT ratio is high, it suggests that the market cap is high relative to transaction volume, often interpreted as an overvaluation signal. Conversely, a low NVT ratio indicates undervaluation.
NVT Ratio is especially useful because Bitcoin doesn’t produce earnings like traditional assets, making typical valuation metrics ineffective. This ratio leverages on-chain data, providing insight into whether Bitcoin’s price is justified by its transaction activity.
The NVT Ratio is especially valuable in understanding speculative activity in Bitcoin. A spike in the NVT Ratio can signal overbought conditions, suggesting that the market cap is growing faster than underlying network activity. A low NVT Ratio may indicate that the price is grounded in actual usage, signaling undervaluation and a potential buying opportunity.
Stock-to-Flow (S2F) Model
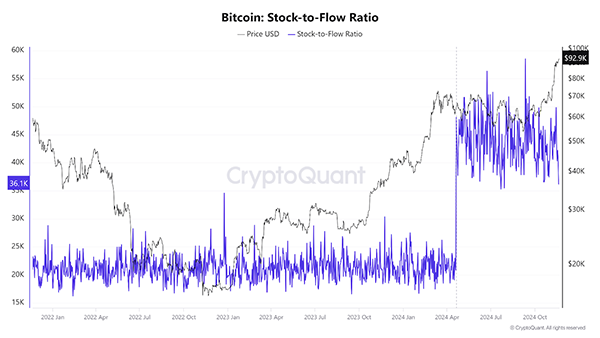
The Stock-to-Flow (S2F) model measures scarcity by comparing Bitcoin’s existing supply (stock) with its new issuance (flow). The model is often used to value scarce assets like gold or silver, which have stable supply flows. For Bitcoin, this model considers its capped supply of 21 million coins and the halving events that reduce the new supply every four years.
How Stock-to-Flow Works
The formula for S2F is straightforward: Stock / Flow = S2F Ratio. For Bitcoin, stock is the current circulating supply, and flow is the new annual issuance from mining. Higher S2F ratios indicate greater scarcity, which has traditionally been associated with higher prices.
Each Bitcoin halving (approximately every four years) cuts the block reward in half, reducing the flow and increasing the S2F ratio. As the ratio rises, S2F theory suggests that Bitcoin’s value should increase due to its growing scarcity.
Bitcoin’s S2F ratio has historically correlated well with its price movements. Halving events lead to increased scarcity, which, according to the model, drives prices higher over time. Although the S2F model has been criticized for ignoring demand factors, it remains a popular metric for long-term Bitcoin valuation.
On-Chain Analysis (Whale Wallet Activity)
On-chain analysis examines blockchain data, which offers insights into network health, investor behavior, and transaction patterns. Unlike traditional analysis relying on market data, on-chain analysis uses blockchain data directly to track transaction volume, wallet balances, and other metrics.
A key focus in on-chain analysis for Bitcoin is whale wallet activity—large Bitcoin wallets controlled by individual or institutional investors. By observing whale activity, analysts can gauge potential buying or selling pressure in the market.
How On-Chain Analysis Works
Several key metrics are used in on-chain analysis:
- Whale wallet activity: Observing large wallet movements, such as funds being transferred to or from exchanges, can signal imminent buying or selling activity.
- Exchange inflows and outflows: An increase in inflows to exchanges often indicates selling pressure, while high outflows may signal accumulation.
- Net realized profit/loss: This shows whether investors are generally realizing profits or losses, helping to gauge sentiment.
When whale wallets move large amounts of Bitcoin, it often signals major price shifts. For example, if a large whale transfers Bitcoin to an exchange, it may indicate potential selling pressure. Conversely, high outflows from exchanges often suggest accumulation and can signal a potential price rally.
Fear & Greed Index
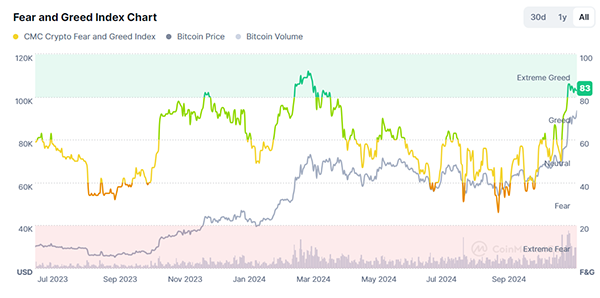
The Bitcoin Fear & Greed Index is a composite indicator that captures market sentiment by analyzing various factors, including price momentum, trading volume, social media activity, and volatility. The index condenses these inputs into a single score between 0 and 100, where a higher score indicates greed (bullish sentiment), and a lower score indicates fear (bearish sentiment).
How the Fear & Greed Index Works
The index is calculated using the following components:
- Volatility: Examines the recent price fluctuation relative to historical trends.
- Momentum and volume: Analyzes current trading volumes and upward or downward momentum.
- Social media sentiment: Tracks the tone and frequency of social media discussions around Bitcoin.
- Bitcoin dominance: Looks at Bitcoin’s share of the total crypto market to assess relative strength.
A score below 25 represents extreme fear, often signaling a buying opportunity, while a score above 75 reflects extreme greed, which can signal an overheated market.
Bitcoin’s Fear & Greed Index is a useful sentiment gauge. During extreme fear, prices are often undervalued, whereas extreme greed usually corresponds with overvaluation. This indicator is widely used for short-term decision-making, particularly in highly speculative markets like Bitcoin.
Conclusion
In summary, understanding these five Bitcoin price indicators can provide valuable insights into Bitcoin’s price trends and market dynamics. The Moving Average, NVT Ratio, Stock-to-Flow Model, On-Chain Analysis, and Fear & Greed Index each bring a unique perspective, helping traders and investors interpret market conditions with greater clarity.
While none of these indicators alone can guarantee success, using them collectively as part of a broader strategy can improve your decision-making.