KEY TAKEAWAYS
- Visual storytelling simplifies complex data for all audience types.
- Animations and visuals help engage researchers, clinicians, and investors alike.
- 3D visuals build transparency, trust, and highlight scientific credibility.
- Digital animations boost outreach, regulatory clarity, and patient education.
3D animation and data visualization have gained significant popularity in the last few years. Not to mention the global 3D market is said to reach $27.33 billion in 2025.
One major solution is using newer tools, such as visual storytelling and animation, that take complex data and make it simpler for both scientific and non-science audiences to engage with important data or learnings from the trial. Static reports do not measure up in our digital world.
In this short article, you’ll learn about the ways that data visualization and 3D animation can transform clinical trials by improving communication, engagement, clarity, and decision-making excellence.
The amount of information obtained during clinical trials is large, and it may appear overwhelming because of a customized presentation. Data visualization is very important in organizing these numbers into a visual narrative that is easy to understand, to show important insights and discoveries.
The information in charts, heat maps, and interactive dashboards helps decision-makers recognize the most important findings because trends and patterns are brought to light, which are often harder to see in spreadsheets.
Pairing data visualization with medical animation further enhances comprehension. Where data graphs show trends and relationships, animations make them come alive, showing a process of biology, mechanism of action of a drug, or response of a patient like a changing population. Such a two-fold method eliminates the possibility of the data being one-sided, i.e., only informing, but not inspiring and promoting educational activities.
The information in clinical trials has to be addressed to different groups of people who include researchers, clinicians, investors, and regulatory reviewers. The level of familiarity with certain issues among each group is distinct, and the use of 3D medical animations will help fill it. Animations represent very technical materials in a scientifically rigorous but simplified way, whereas data visualizations represent supportive arguments in a digestible way.
For investors and partners, crafting a compelling story is just as vital as accuracy. Evidence of efficacy and safety could be visualized by data-driven animation to move towards confidence in the prospect of a product. To the clinician, animation is useful in describing complex modes of action, which allows further understanding of how and why a treatment works.
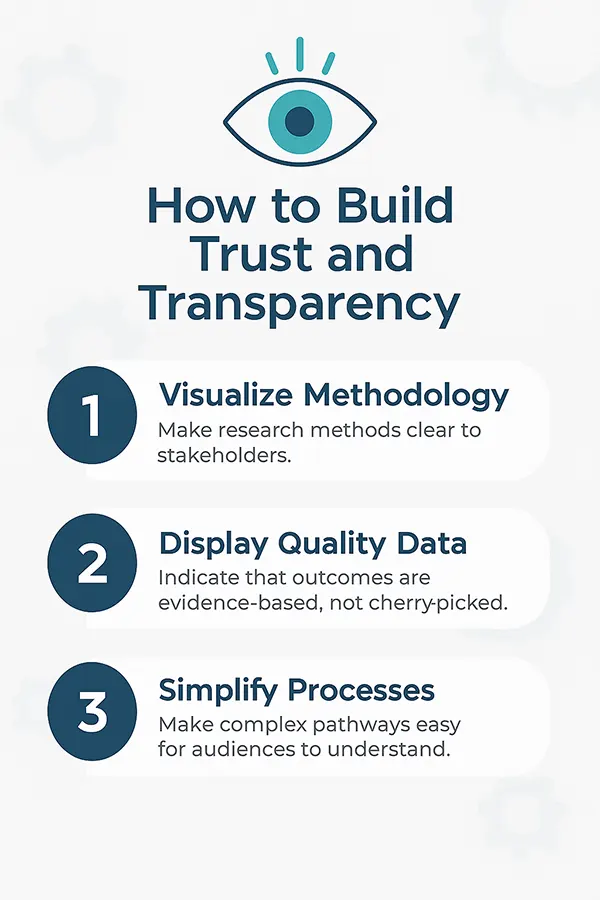
Transparency is a cornerstone of credible clinical research. Visualizing data helps boost stakeholder confidence by making complex information clear and trustworthy. Quality visualization assists in illustrating methodology and data integrity in the display that indicates that the outcomes are evidence-based, as opposed to data being cherry-picked.
3D medical animations introduce an additional element of trust since the process of the trials, e.g. randomization, blinding, pathways of the people involved, can be visualized. This will make the process of clinical trials less mysterious and more digestible, which will limit misunderstandings and will encourage people to accept the findings more readily. Below, you can see proven ways to build trust and transparency.
In addition to research teams and investors, the information of clinical trials is frequently available to regulatory bodies. Scientifically sound, clear graphic material may assist in explaining the complicated features of either study design or drug performance. Visual summaries alongside technical documents make regulatory content easier to understand and review.
When the approvals are obtained, the same visual material could be used in marketing and in educating patients. New therapies require depicting science to the citizenry in a transmutable mode as the video animations and computational visualization brings out. This is useful in creating awareness and trust among people even before a product is in the market.
Since digital channels now move to the forefront in the world of healthcare communication, 3D medical animations and interactive data visualization are particularly useful. They’re easily adaptable for websites, virtual meetings, and social media, helping clinical trial narratives reach broader and more diverse audiences. Animation and visualization software can be easily updated so that the message does not lapse as new information comes up.
In the arena of short attention spans and vying to capture interest with high-quality data visualization, pairing these two attributes is the most appropriate way to make sure intricate clinical trial narratives are not merely discovered but come to fruition. The model is a digital-first strategy, which leads to better decisions throughout the healthcare ecosystem.
The narrative about one of the clinical studies cannot be offered in the form of statistics and graphs. Combining data visualization with 3D medical animation will allow healthcare corporations to create engaging stories out of complicated data. Such an approach enhances the communication with the researchers, investors, regulators, and the general public.
By doing that, it would not only contribute to better understanding but also create confidence, facilitate adherence, and facilitate the eventual success of innovative medical solutions.
Ans: It provides clarity around complex trial data, enables the identification of trends, and allows stakeholders to quickly understand and interpret important results.
Ans: It can visualize complex processes like drug mechanisms. This can make complex scientific data loops more engaging and accessible for different audiences.
Ans: Yes, the clarity of animated videos or post-process animated graphics and diagrams supports complex technical documentation by simplifying complex concepts for consideration and review.